How We Calculated Customer LTV for Mak.by, and Why We Watch the Second Order
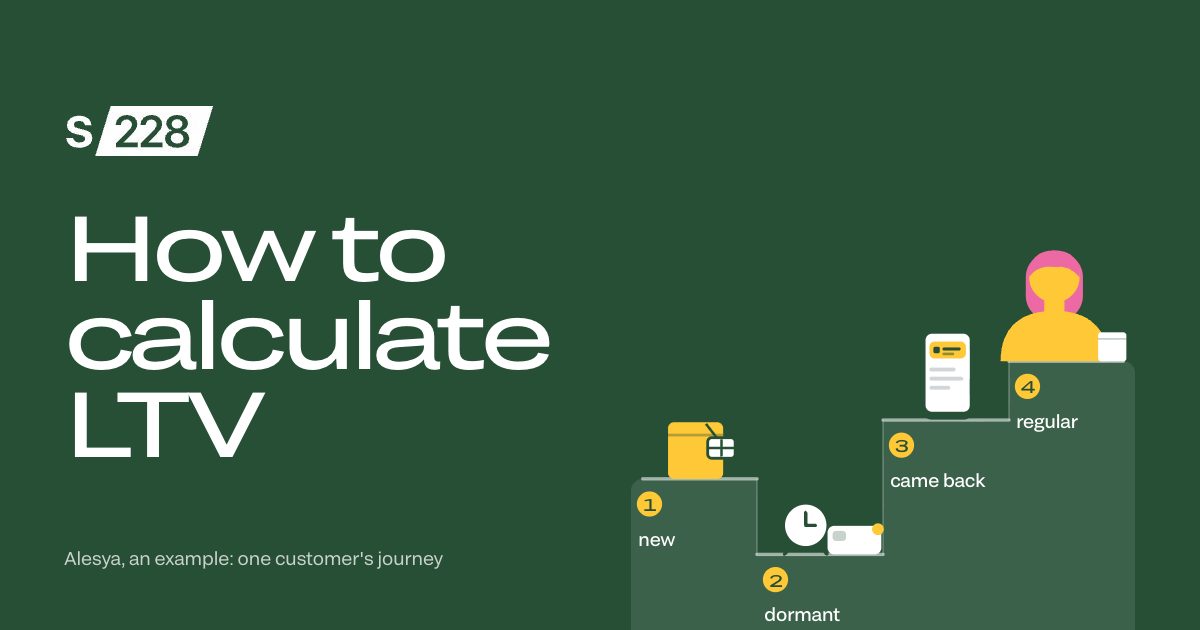
Mak.by wanted to understand who their customers are, why some come back and others don't, and which promos work for whom. We took every delivery order from just over two years and calculated customer LTV not as one number, but for each customer group, month by month.
Time moves customers down. Only an order moves them up.
A customer slides into "dormant" on their own, and climbs back only by placing a new order.
The second order decides it.
Customers who order again quickly are more likely to become regulars.
Measure the game in regulars.
Its effect doesn't show in orders, but more customers became regulars in its first weeks.
Why average LTV doesn't work
The textbook formula: average order value × purchase frequency × customer lifespan. But in food delivery, there is no average customer.
Plenty of customers order just once a year. A few order dozens of times and drag the average up. So average LTV comes out noticeably higher than the median, and any plan built on it is built for a customer who doesn't exist.
A small group of customers places most of the orders. They're the reason we do all this math.
The real goal: turning customers into regulars
Many customers never come back. Of those who place a second order, most stop after a few. The money comes from the ones who make it a habit. So winning a customer back isn't enough. You have to get them to the habit.
How to calculate LTV by customer group
Every order tied to a customer ID, checked against the client's own reports
Six groups: regulars, new, returning, casual, dormant, churned
Every month: who moved where
For every day: weather, holidays, promos, the game, advertising
A separate LTV for each customer path
Anything that looks like a cause gets tested against a control group
What drives repeat orders in food delivery
| Factor | Effect | Confidence |
|---|---|---|
Rain | ↑orders, lapsed customers respond more than regulars | both years |
Holidays and the days before them | ↑ | both years |
Friday to Sunday | ↑ | both years |
Valentine's Day | ↑one of the strongest days | both years |
December 31, the days after holidays | ↓ | both years |
Promos | we see a link, not a cause | needs a test |
In-app game | orders can't be separated from the season; more regulars | needs a test |
Weather and holidays move individual days but barely touch the month. Regulars order in any weather, while rain brings back the people who haven't ordered in a while.
Time moves customers down, only an order moves them up
Most of the time a customer changes group without doing anything at all: time simply passes. So we went looking for what makes people order.
- 1January 12first order, new
- 2Marchno orders, dormant
- 3May 18rain, orders again, returning
- 4Juneorders every Friday, regular
- 1January 12first order, new
- 2Marchno orders, dormant
- 3May 18rain, orders again, returning
- 4Juneorders every Friday, regular
How to win the second order after the first
Customers who arrived through a promo code with a free gift on their first order came back less often. A gift on every order above a set amount brought new customers back more often. And people who placed a second order within their first week were the most likely of all to become regulars.
What we suggested: test a gift on the second order against a control group.
What the in-app game actually did
In orders, the game looked like any other summer: the biggest spike came two weeks before it, driven by rain and other promos. But in the game's first weeks, more customers became regulars than before it, and more than in the same weeks a year earlier. Once the game ended, things went back to normal. There was no control group, so this is an observation. Only a test can prove it.
Why we track 90-day active customers
LTV takes a year to show. 90-day actives show up every month. The biggest group falling out of them: new customers who never placed a second order.
What to take away
- Rebuild your customer groups every month
- Calculate LTV by customer path, not by averages
- Test a second-order gift against a control group
- Measure a game by how many customers become regulars
- On rainy days and holidays, message the people who haven't ordered in a while
How we calculated it, and why there are no numbers
Every finding was checked by at least two different calculations. We also swapped the real dates for random ones: if the "effect" shows up there too, it's a coincidence. The game and the gift didn't pass this check, so we report them as things we noticed, not proven effects. Mak.by's data is under NDA, which is why there are no numbers.
Let's calculate your customers' LTV
Want to calculate your customers' LTV and find out what brings them back? We'll set up analytics and retention for your business.
FAQ
- What is customer LTV in plain English?
- How much money a customer brings in over their whole time with you, not on a single order.
- What is the formula for customer lifetime value?
- The textbook one: average order value × purchase frequency × customer lifespan. In food delivery it describes an average customer who doesn't exist, so we calculate it by group.
- Why is average LTV misleading?
- A small group of the most active customers pulls the average up. A typical customer orders less often than the average one, so look at the median and at customer groups.
- How do you calculate customer LTV when customers are so different?
- By path: one order, came back, became a regular. Each path has its own LTV.
- What is RFM analysis?
- Grouping customers by how recently, how often and how much they buy. Recency and frequency were enough for us; we handled the money side in LTV.
- How often should you rebuild the groups?
- Once a month. That's how you see where people are moving.